For this release, FastClose have applied a major focus on simplifying the Designer application, with particular regard to users new to FastClose.
For example:
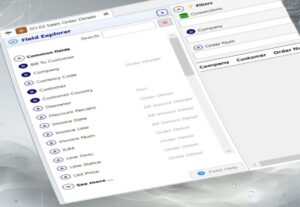
 presenting only the most commonly used fields and measures initially, removing the noise of all the lesser used items, to make it easier to find information a user would most frequently want to use in a report.
- the full dimension tree that goes beyond those commonly used data points, has also been simplified
- we now leverage our longstanding library feature to make it easier to deliver consistency across reports, whether it be a standard look and feel to the formatting, the setup of variables such as ‘This Month’ or pre-built P&L structures. Getting going is now even quicker.
- a search feature to help you locate that report you want when you have lots of folders or similar items with similar names.
- and numerous other nips and tucks that smooth the user experience.
 presenting only the most commonly used fields and measures initially, removing the noise of all the lesser used items, to make it easier to find information a user would most frequently want to use in a report.
Performance
T he performance of reports that are calculation intensive has been increased by a factor of up to 6. The benefit increases with the number of rows and columns and the number of calculations required. This is the latest boost in a series of improvements delivered with 3.0 and 3.1, resulting in many complex reports taking less than a tenth of the time they took just a few versions ago.
Additional performance improvements have also been achieved whilst opening reports, from retrieving folders in the FastClose repository, to discovering the ERP schema.
Calculations
 A powerful new calculation engine adds the ability to define an extensive new range of calculations, such as date arithmetic, text manipulation, and so on with a library of over 50 functions included
Some common examples include:
- Determining the number of days between two dates, such as between order date and ship date
- Choosing a second column if the first column is empty, for example the estimated shipping date if the shipping date is missing
- Subtotaling sales orders by the calendar month of the order date
- Calculating differences in prices, such as the variance between the price on the invoice versus the price list
- Picking the maximum or minimum of a set of amounts, often needed when calculating discounts or commission
Power BI Integration
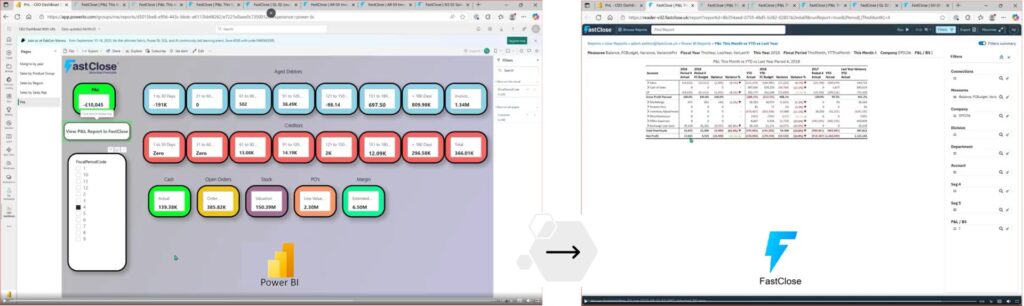
It is now possible to navigate from an online Power BI Dashboard to a FastClose Web Reader report, passing the Power BI filter settings, to tell a joined-up story from the chart – following the numbers into the source data and on.

FastClose Cloud for On-Prem
 Just because your ERP is On-Prem, doesn’t mean your FastClose Server has to be.
Through a secure data pipe between your on-prem infrastructure and your FastClose Server in the cloud secure reporting can be delivered to your users wherever they are in the world without even needing a VPN.
Liberate both your users and your data without compromising security.