“Why”, you have to ask, “have ERP companies failed to do this?”
Well, to be fair to the ERP vendors, their primary concern is to build a system that can handle large volumes of data and manage the business and data flows that drive information from table to table to run your business and provide accurate numbers. But the architecture necessary to support this processing doesn’t really lend itself to what is required for heavy duty reporting and consolidation. Further, the skillset required to create a reporting tool that can pivot data, build hierarchies, numerous calculations, and drill to transactions, is quite different.
Excel fills the Gap – but which Version is the “truth”?
In the absence of quality reporting tools, Excel fills the gap. And ‘gap’ is a good word to use when describing the use of Excel. Hundreds of spreadsheets, each with different versions of the truth. Often undocumented and with un-auditable cell calculations, augmented with complex macros, just adds to the problem.


The Traditional Excel Approach
For all these users, Excel is King. So the question is “how does your secure ERP data, get there?”
The most common way that we see across the many accounting teams we work with, is to simply dump the entire trial balance into Excel and then, through a blizzard of VLOOKUP and SUMIF formulae coupled to pivot tables, build the summary information that is needed for the management reporting pack.
The source extract for this process can take time as Excel needs the detail before it can summarise the data. And it is repetitive and slow, as every time an error requires correction by a journal entry, the extract and summarisation process has to be repeated. So much for real time information at month end!
What is interesting is the manual nature of the approach, which spurns the many spreadsheet add-in products on the market that promise real time and accurate information, yet strangely fail to deliver either.
So what is the problem with these tools?

And whilst many tools will ship with an understanding of the GL out-of-the-box, few go further to the subledgers, leaving users the unenviable task of having to learn and understand the underlying table structures if they are to have any chance of reporting on those numbers.
And then, because it is so slow to repeat the extract and shape the data, there is the temptation to fix data errors in the spreadsheet rather than in the source ERP. A slippery slope that in effect makes it possible to manipulate the numbers, any way you want.
And all of this is a real shame, as one of the main reasons to even use a computer is to automate and eliminate manual and repetitive tasks.
So how is FastClose different?
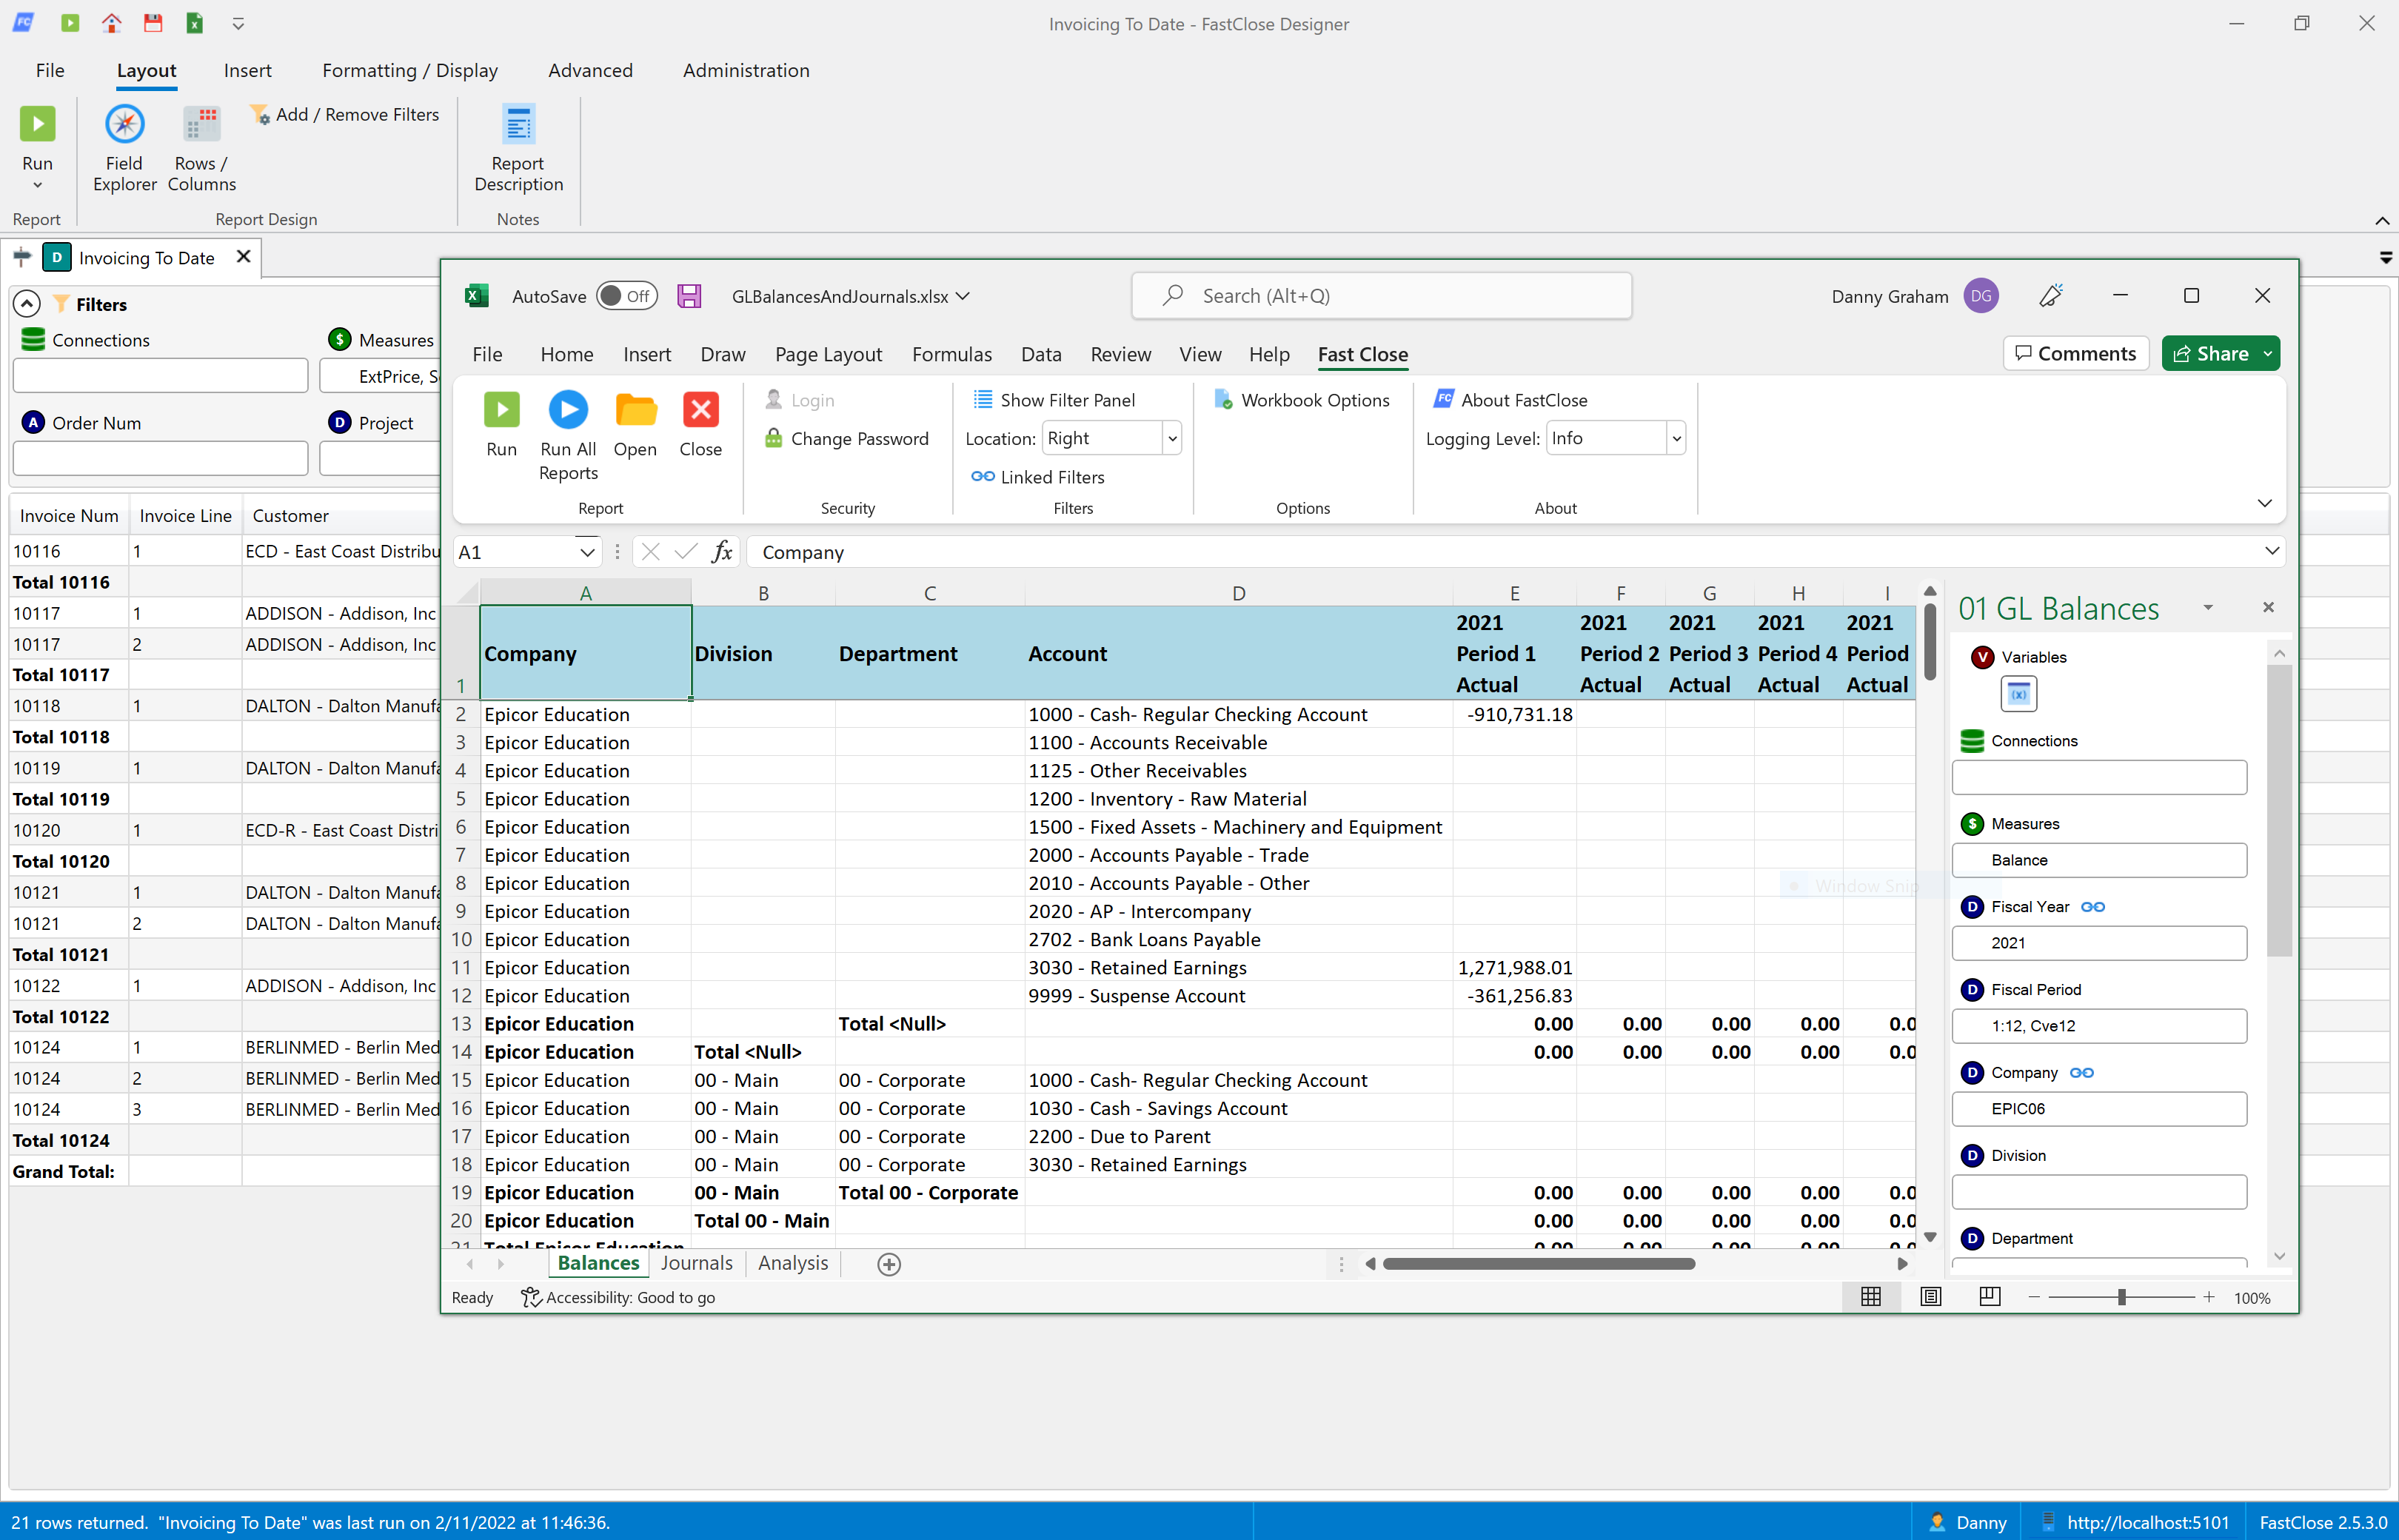
FastClose is form based. You approach the report building process by first building the complete financial statement in the FastClose Designer interface.
Using our calculation engine, designers can specify a calculation expression just once yet apply it to an entire array of cells, eliminating both complexity and ‘copy and paste’ errors.
Another common issue we see when replacing a prior spreadsheet solution is that of missing nominals. This is the scenario where a new code has been added to the ERP during the year, but never added to the spreadsheet, so the numbers are wrong. Leveraging our hierarchy engine, Designers can use ranges and wildcards to simplify the design whilst also ensuring they cover every code in the ERP and never miss a nominal. And it is simple to add a ‘Check’ line to such a statement to ensure the P&L numbers always match that of the ERP system, providing belief in the numbers.
Starting from this one report, the FastClose Excel plugin enables you to extend the Workbook, adding as many additional pre-built FastClose reports into separate worksheets as needed. These reports can then be referenced by further modelling sheets using VLOOKUPs to create a Cash Flow for example, and so the management pack comes together.
Finally, with no need to correct data in the workbook, issues can instead be fixed in the ERP with whatever journal postings are needed, and then with the click of a single button, FastClose can refresh all the reports in real-time, delivering the latest information from the ERP system.
In Conclusion

Further because it is not just GL data that can be used but all the modules that FastClose provides, it becomes possible to deliver one of the most important real time reports of them all: the cash flow forecast. Based on reports like AP aging, AR aging, current bank balances, sales orders not invoiced, standing orders, goods received not invoiced and open purchase orders. Real time data is imperative but without access to these subledgers, which FastClose provides, impossible to deliver.
FastClose is backed by a full security and permissions model which both secures your data from those users who should not have access and gives total confidence in the numbers for those who do.
For a demo of the FastClose Excel Add In
